Retail is one of the most important business domains for data science and data mining applications because of its prolific data and numerous optimization problems such as optimal prices, discounts, recommendations, and stock levels that can be solved using data analysis methods. The rise of omni-channel retail that integrates marketing, customer relationship management, and inventory management across all online and offline channels has produced a plethora of correlated data which increases both the importance and capabilities of data-driven decisions.
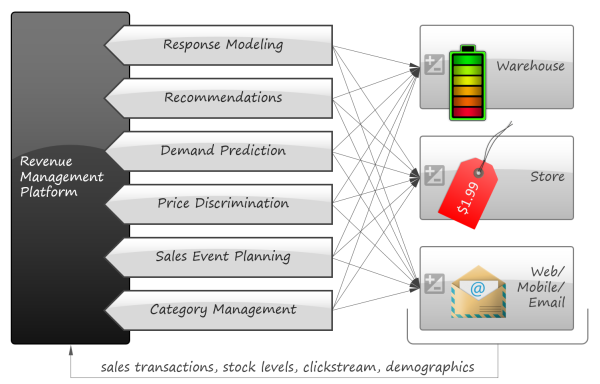
Although there are many books on data mining in general and its applications to marketing and customer relationship management in particular [BE11, AS14, PR13 etc.], most of them are structured as data scientist manuals focusing on algorithms and methodologies and assume that human decisions play a central role in transforming analytical findings into business actions. In this article we are trying to take a more rigorous approach and provide a systematic view of econometric models and objective functions that can leverage data analysis to make more automated decisions. With this paper, we want to describe a hypothetical revenue management platform that consumes a retailer’s data and controls different aspects of the retailer’s strategy such as pricing, marketing, and inventory:
There are two major reasons why this study focuses on a combination of economic frameworks and data mining methods:
- Hundreds of economic models relevant to retail can be found in economic textbooks and articles because markets, discounts, competition etc. were a subject of intensive research over the last century, if not longer. However, many of these models are highly parametric (i.e. defined by rigid equations with a finite number of parameters) and not flexible enough to model real life with sufficient accuracy. Data mining offers a variety of techniques for nonparametric modeling that helps to create flexible and practical models. Many articles and case studies published during the last decade successfully achieve the balance between abstract models and machine learning.
- Fast data circulation in modern retail enables retailers to make accurate forecasts using relatively simple models because small incremental predictions are generally simpler than big decisions. For instance, it might be difficult to calculate the optimal price for a new disruptive product because its perceived value is not known, but it can be relatively easy to automatically adjust promotion prices in real time depending on demand and inventory levels. Some commercially successful solutions for price optimization discard most of economic modeling simply moving prices up and down depending on closed loop feedback from point of sales [JL11].
These two considerations suggest a high potential for automated decision making and dynamic optimization in retail, so we were keen to study this subject. Most of this article represents an overview of the results published by retailers and researchers who built practical decision making and optimization systems combining abstract economic models with data mining methods. More specifically, the article was inspired by three major case studies from Albert Heijn [KOK07], the largest supermarket chain in the Netherlands, Zara [CA12], an international apparel retailer, and RueLaLa [JH14], an innovative online fashion retailer. We also incorporate results from Amazon, Netflix, LinkedIn and many independent researchers and commercial projects. At the same time, we avoid academic results with little or no empirical support.
The study focuses mainly on optimization problems related to revenue management discipline which includes marketing and pricing questions. More specialized data mining applications like supply chain optimization and fraud detection are out of scope, as well as the implementation details of the data mining process (such as evaluation of model quality).
The rest of the article is organized as follows:
- We first introduce a simple framework that ties together a retailer’s actions, profits and data. This framework will later be used to describe analytical problems in a more uniform way.
- The main body of the article represents a catalog of optimization problems relevant to retail. We describe the problems one by one in separate sections. Each section provides a brief problem statement, a list of business use cases and applications, and a detailed description of how the problem can be decomposed into econometric models and data mining tasks that help to solve the business problem by means of numerical optimization.
- We next provide a section that discusses the economic benefits that can be expected in practice.
- Finally, we conclude the article with a discussion of dependencies between the considered problems to figure out common principles and important cross-cuts.
[This article is also available in PDF – see the Whitepapers page.]
The Optimization Framework
This article describes six major optimization problems related to marketing and pricing that can be solved leveraging data mining techniques. Although these problems are very different, we are trying to establish a common framework that helps to design optimization and data mining tasks required for solutions.
The basic idea of the framework is to use an economic metric such as gross margin as the optimization objective and consider it a function of possible retailer’s actions such as marketing campaigns or assortment adjustments. The econometric objective is also a function of data in the sense that econometric models should be parameterized by properties of a particular retailer to produce a numerical value, such as gross margin, at its output. For instance, consider a retailer planning a marketing mailing campaign. The space of possible actions can be defined as a set of send/no-send decisions with regard to individual customers and the gross margin of the campaign depends both on actions (who will receive the incentive and who will not) and data such as expected revenue from a given customer and mailing costs. This approach can be expressed in more formal way by the following equation:
\quad (1)")
where 

")

The design of the model 
The role of data mining in the optimization problem (1) is crucial because econometric models
Problem 1 : Response Modeling
Problem Statement
Some resource such as an advertisement or a special offer will be distributed to a group of customers. Each unit of the resource is associated with a monetary cost such as the mailing cost of a printed catalog, or some negative effect (such as causing a customer to unsubscribe from irrelevant email notifications). At the same time, the resource can influence customers’ decisions urging them to make more purchases, buy promoted products etc. The goal is to find a set of the most promising candidates who should receive the resource in order to maximize the overall performance of the targeted group of customers.
The resource can be homogenous (i.e. all participating customers will get the same incentive) or personalized. In the latter case, a retailer has a set of different incentives such as discount coupons on different products and the goal is to offer a unique subset of incentives or no incentives to each customer to maximize the overall performance.
Applications
Response modeling is widely applicable in marketing and customer relationship management:
- Targeting specific discounts, coupons, and special offers requires the identification of customers who are likely to respond on the offer.
- Targeted mailing campaigns and special gifts (e.g. free sunglasses from a car dealer) often require the identification of the most valuable customers to reduce the marketing costs.
- Customer retention programs can require the identification of customers who are likely to stop the relationship with a retailer but can change their minds under the influence of incentives. For instance, an online retailer can send a special offer to customers who had abandoned their online carts or search sessions before the checkout.
- Online catalog and search results can be rearranged depending on a customer’s likeliness to respond to particular items.
- Response modeling helps to optimize email campaigns to avoid unnecessary spamming which can cause customers to unsubscribe from email notifications.
Solution
From the points we’ve talked about above, we now realize that the problem of resource distribution is an optimization problem that should be driven by an objective function. One of the most basic approaches is to model the overall profit of the campaign in terms of probability of response and the expected net value for a customer. Let us denote the entire population of customers as 

\cdot (g(u|R) - c) + (1 - Pr(R|u;I))\cdot (-c)\quad(1.1)")
where ")


)")

 \cdot (g(u|R)-c) + (1-Pr(R|u;I))\cdot (-c) = Pr(R|u;I)\cdot g(u|R) -c =\\= E\left\{g|u;I \right\}-c")
where 
\cdot g(u|R)>c")
and the optimal subset of customers 
")
This approach can also be considered the maximization of targeted net value compared to random resource distribution. To see this, let us compare these two options assuming a fixed number of customers 
-|U|(E\left\{g|I\right\}-c)=\\=\underset{U\subseteq P}{argmax} \sum_{u\in U}\left(E\left\{g|u;I\right\}-E\left\{g|I\right\}\right)=\\=\underset{U\subseteq P}{argmax}\sum_{u\in U}E\left\{g|u;I\right\}\quad,\quad |U|=const \quad (1.3)")
where 
=\underset{U\subseteq P}{argmax}\sum_{u\in U}E\left\{g|u;I\right\}\quad,\quad |U|=const")
However, it can be argued [VL02] that this model is imperfect because it favors customers who are likely to respond to an incentive, but does not take into account customers who are likely to respond anyway generating the same profit even without incentives. To address this shortcoming, let us separately calculate the gross margin for the set of customers
– select U according to the equation (1.2) and send incentives to everyone in U
– select U randomly and send incentives to everyone in U
– select U according to the equation (1.2) but do not send incentives at all
– select U randomly but do not send incentives at all
 – select U according to the equation (1.2) and send incentives to everyone in U
 – select U randomly and send incentives to everyone in U
 – select U according to the equation (1.2) but do not send incentives at all
 – select U randomly but do not send incentives at all
The equation (1.2) maximizes the difference 
-(G_3-G_4)")
")
where the last term corresponds to the expected net value for customers who were not provided with the incentive. This approach is known as differential response analysis or uplift modeling [BE09].
It is worth noting that the expressions (1.2) and (1.4) are not necessarily optimized by maximizing marketing budgets. Consider the situation when the response net profit is $100 per customer and the incentive cost is $1. If a group of 1 million customers contains 0.5% potential responders, the most expensive marketing campaign that reaches each customer will effect a loss of $500K (the total response net value of $500K minus the campaign cost of $1M). At the same time, a data model that identifies ten thousand of the most likely customers with a response probability of 5% (10x lift) will produce a profit of $40,000 (a total response value of $50,000 minus the campaign cost of $10,000).
The equation (1.4) is especially important for different types of price discounts (coupons, temporary price discounts, and special offers). Consider the following question: “Should a retailer offer a discount coupon on apples to a person who buys apples every day?” This question would most likely will be answered in the affirmative according to the equation (1.2) because the person is likely to redeem a coupon. However, it is more probable that the customer would just buy the same amount of apples for a lower price, basically decreasing retailer’s profit. The equation (1.4) alleviates this problem by incorporating default customer behavior. We continue to discuss price discrimination in the next sections because it is a complex topic that goes far beyond the equation (1.4).
The mathematical expectations of the net revenue in the equations (1.2) and (1.4) can be estimated by means of classification and regression models trained on historical data for customers who have received incentives in the past and those who did not. This problem can be very challenging, especially when the incentive under evaluation is somewhat dissimilar to everything used in the past; in this case, the incentives may require testing on a customer panel before running a full-scale campaign. Moreover, gross margin is not the only performance metric that is important for retailers. The gross margin metric, in the sense it is used in the equations (1.2) and (1.4), is concerned with the immediate return from the first purchase which is a very simplistic view of customer relationship management. A retailer might be concerned with a variety of other metrics and this variety is so huge that there is a separate econometric discipline – propensity modeling [SG09, LE13] – that develops different models that predict customers’ future behaviors. The most important propensity models include:
- Predicted lifetime value. The lifetime value model is one of the most important models that estimates the amount of revenue or profit a customer will generate over his or her lifetime. This metric is especially important for campaigns that aim to acquire new customers.
- Predicted share of wallet. The share of wallet model estimates how much a customer spends at a given retailer compared to how much he or she spends at competitors for some category of products such as groceries or apparel. This metric reveals customers with high revenue potential, hence it can be used in loyalty programs and usage expansion campaigns.
- Propensity to category expansion. This model estimates the likelihood of first-time spending in certain product categories e.g. switching from casual to luxury products. This model helps to design targeted usage expansion campaigns.
- Propensity to churn. This model estimates the likelihood of stopping to buy from a given retailer permanently and switching to competitors. Customers with a high propensity to churn can be targeted in retention campaigns. For instance, a retailer can identify customers who abandoned their online shopping carts or search sessions but are likely to proceed to order placement if offered a discount or gift.
- Propensity to change shopping habits. Each customer has shopping habits that eventually determine a customer’s value for a retailer – how often the customer buys, what products, from what categories etc. These habits are generally stable over time, and once a retailer manages to change a customer’s level of engagement, this level tends to last. Consequently, retailers are generally interested to find customers who are open to change their habits – people who moved from one city to another, graduated a school or university, just married and so on. The canonical example of such modeling is Target’s attempt to predict customers’ pregnancies in the early stages [DG12] because births obviously change the way customers shop.
The models above can be embedded into a framework similar to the equation (1.4) as the alternatives to the gross margin objective. We will take a closer look at propensity modeling in a later section dedicated to price discrimination where we will model propensity to response on a discount. More details on propensity modeling can be found in dedicated studies and books like [FX06] and [SG09].
The framework can also be extended to select an optimal incentive among multiple alternatives. For instance, a retailer can estimate the expected performance of two incentives A and B (e.g. chocolate ice-cream versus vanilla ice-cream) and then select the optimal option for a given user according to the following criteria [WE07]:
")
Finally, it is worth noting that the problem of response modeling is tightly coupled with customer segmentation:
- Response modeling can be used to validate feasibility of customer segments discovered by clustering. A segment that consistently responds to a certain marketing program is actionable and solid.
- Propensity models are regression and classification models trained on customer data. The analysis of principal regressors can suggest customer segments. On the other hand, clustering can suggest suitable propensity models.
Problem 2 : Recommendations
Problem Statement
There is a set of incentives where each incentive corresponds to a product or some other catalog item. Incentives are not associated with direct monetary costs, but only a limited number of incentives can be shown to a customer. In that respect, each incentive has a cost in terms of screen space or a customer’s attention span, so the negative effect of providing a customer with a given incentive can be measured as lost opportunity costs. The goal is to suggest a personalized subset of incentives (e.g. recommendations on a website) to each customer to maximize the purchasing performance of the population.
Applications
The most typical use cases for this problem are recommender systems, personalized search results ranking, and targeted ads. However, there are a number of other important applications:
- Manufacturer-sponsored discounts can fall into this category because a retailer is not concerned about the cost of the incentives (covered by the manufacturer), only about efficient targeting. Manufacturer-sponsored campaigns are widely used in many retail subdomains such as grocery or department stores because manufacturers heavily rely on promotions to increase their market shares.
- Cross-sell marketing can benefit from recommendation models because some recommendation techniques are able to reveal implicit dimensions in a customer’s profile, like lifestyle. This ability is especially useful as cross-category recommendations, such as furniture or kitchenware, can be based on a customer’s purchases in the apparel department.
- Recommender systems are able to generalize a customer’s purchase and browsing histories into a psychographic profile in the sense that behavioral patterns such as grunge dressing or sporty lifestyle can be quantitatively measured. The same techniques can be used to profile competitors by what they sell similarly to how customers are profiled by what they buy. It can help to reveal tendencies in competitor’s assortment planning and other strategic moves.
- Some recommendation algorithms are able to classify textual descriptions of products in terms of psychographic dimensions like lifestyle, so merchandisers can leverage them to assess product descriptions and get suggestions on proper wording for preferred product positioning.
It is critical to note that although recommendations are typically considered as a relatively specialized online service, the principles and techniques developed for recommender systems are fundamentally important for many aspects of retail because they aim to reveal the hidden mapping between the customers and products these customers are interested in. It is a principal task for any retailer.
Solution
Recommender systems have been a subject of extremely intensive research during the last two decades, and books [JZ10, RR10] were written to provide a systematic view on dozens of recommendation algorithms and techniques suggested in numerous articles, presentations and whitepapers. To a certain extent, such a high diversity of recommendation techniques is attributed to several implementation challenges like a sparsity of customer ratings, computational scalability, and lack of information on new items and customers. Clearly, we cannot overview even a fraction of these methods and algorithms in this section and it does not make a lot of sense to try to do so because many overviews of all kinds are widely available. Instead we will focus on the objectives and utility functions that drive the design of the recommender systems and mainly bypass the algorithmic and technical sides of the problem.
From an econometric perspective, the problem of recommendations is closely related to the rapid expansion of assortment in many retail sectors expedited by ecommerce and omni-channel commerce. Large assortment increases the number of slow moving items each of which has a small sales volume and contributes little to revenues, but the overall contribution of this “long tail” is significant:
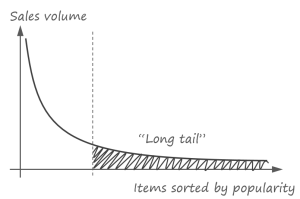
Traditional recommendation techniques like advertising best sellers become insufficient to leverage the potential of slow moving items and more sophisticated recommendation methods are needed to guide the customer through the millions of items that he or she will never explore completely without suggestions.
Since we are mainly concerned with the models that describe customer preferences in regard to products, let us walk through the most widely used recommendation techniques ranging them by complexity of utility functions, starting from relatively simple and moving towards more advanced. We will use the hierarchy of recommendation techniques depicted in the figure below. This hierarchy resembles the commonly used classification of the recommender systems, although not exactly the same:
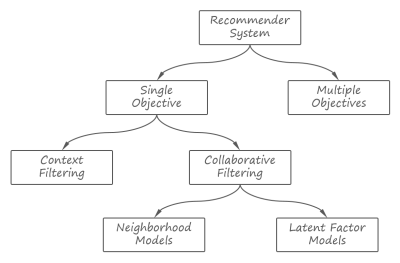
Multiple-objective solutions are especially interesting in the context of this study because they can incorporate economic goals alongside simple relevancy.
Single objective. Let us start with a basic definition of the single-objective recommendation task that is widely used in the literature on the recommender systems. A retailer sells line items 


")
There are two natural ways to approach the problem of rating prediction: to estimate a rating score for each user independently by looking for items that are similar to what this particular user liked in the past; and to estimate the rating scores by averaging the ratings from users similar to a given one. These two approaches are known as content filtering and collaborative filtering, respectively.
Content filtering. The main idea of content filtering is to predict ratings by comparing past user preferences, behavior and purchases with the product items. Although different interpretations of content filtering are possible, we choose to treat it as a classification problem [PZ07] to highlight usage of data mining methods:
- Each user can be considered a regression model that predicts rating for items. A particular case of such a model is a binary classifier that classifies items into two categories – “like” and “doesn’t like”.
- A user profile is an instance of the regression model introduced above. This model is trained using known rating for the user (explicit rating, purchase history etc.)
- A list of recommended items for a given user is obtained by predicting the ratings for the catalog items using the user profile regression model and selecting a subset with highest estimated ratings.
Although the process above seems to be relatively straightforward, it is very challenging because users and items are fundamentally different entities and it is difficult to find a representation for catalog items that can be directly transformed into such a subtle thing as user preferences by means of a regression model.
The main problem is that standard inventory attributes such as a brand, product name, or price are typically insufficient to measure the utility of an item to a user. Although some customers can be satisfactorily characterized by loyalty to a certain brand or price category, more subtle and informal dimensions like lifestyle or temperament are required to describe observed patterns and commonalities. These implicit dimensions are crucial for products like movies, books, music, and even for more tangible goods like apparel. A retailer can leverage standard classification techniques to label items with implicit dimensions as follows [GH02]:
- Merchandisers manually rate a subset of items in terms of intangible properties. For instance, garments can be characterized by criteria like trendy, conservative, sporty etc.
- Standard product attributes like textual descriptions are designed to deliver a particular marketing message to customers, hence they implicitly contain some intangible attributes. So the subset of manually rated items is used to build classification models that map product attributes to point to implicit dimensions. For instance, one can use the Bayesian classification approach to estimate the probabilities Pr(word in item description | implicit attribute value) that describe how each dictionary word connotes to implicit characteristics.
- The rest of the catalog then can be automatically classified by calculating the a posteriori probabilities Pr(implicit attribute value | item description).
Content filtering in general and item modeling in particular is the information retrieval task, so many text mining and search techniques (for example, see [MA08] for an overview) are typically leveraged to build a recommender. We omit these details here because they are not so important from the econometric perspective.
Collaborative filtering. The problem of implicit dimensions noted in the previous sections has crucial implications that lead us to the second family of recommendation techniques. This problem naturally arises in connection with the fundamental inability to rigorously model human tastes and judgments. Collaborative filtering represents a natural and probably the only possible solution that does not require manual training of the system – the need of a “human factor” in recommendation decisions is satisfied by using the feedback from other users.
The basic collaborative filtering model [RE94, BR98] is straightforwardly defined based on the similarity metric between users:
 (r_{v,j}-\bar{r}_v)\quad(2.1)")
where 

")


assuming that 
The similarity function is typically calculated as a cosine distance or Pearson correlation coefficient between the rating vectors for 
The model (2.1) has significant drawbacks because of high computational complexity that grows proportionally to both the number of items and the number of users, and a sparsity of user ratings. A sparsity of ratings means that each user rates only a small fraction of available products, so the vectors 
(r_{u,i}-\bar{r}_{u,i})\quad (2.2)")
where the similarity metric between the items is based on the ratings from all users they have in common and the baseline rating 
The models (2.1) and (2.2) belong to the family of so-called neighborhood models that estimate rating by analyzing the neighborhood of most similar users or items. This family also includes a huge variety of techniques [SU09] that replace computationally expensive inspection of the neighborhood by more compact probabilistic models or other approximations.
Although neighborhood models are a proven recommendation technique known to be used by leading retailers like Amazon, they still suffer from the fundamental problem of the implicit dimensions we discussed in the context of content filtering. The user-to-user and item-to-item similarity metrics considered above are limited in their ability to reveal a complicated relationship between users and items. A similar problem appears in information retrieval when text documents are looked up by a search query – synonymy (multiple ways to express the same idea or concept using difference words and linguistic structures) and polysemy (multiple meanings of the same word or expression) phenomena make it very challenging to reveal the actual intent of a person who composed the query and to adequately translate this intent into a similarity measure between the document and query. To cope with this problem, a technique called Latent Semantic Analysis had been proposed in [DR90]. Ten years after, this method has been utilized in the design of recommender systems [SA00] creating a new family of Latent Factor models.
The main idea of latent factor models can be described as follows: the rating function R can be represented as 


- Smaller dimensionality helps to concentrate the energy of the signal, so each basis vector significantly contributes to the rating estimation. It reduces the noise by discarding minor fluctuations that simply do not fit the smaller basis.
- The basis computation process can be designed to produce a basis vector with minimal interdependencies, effectively reveling major tendencies in users’ tastes, each of which corresponds to a basis vector. For instance, when this approach has been used by Netflix to predict movie ratings [YK08, YK09], the system has produced dimensions that clearly corresponded to axis like drama-comedy, men-women target audience etc.
The goals above can be achieved by means of dimensionality reduction because of correlations in the original data representation R. As an illustration, consider the following example of two-dimensional data:

Each point in the set has substantially large coordinates both along 


To a certain extent, the latent factor model can be compared to how discreet cosine transform (DCT) is used in image compression algorithms like JPEG to approximate the image by a few harmonics.
This chain of thinking leads us to the following formal model of the latent factors. One first selects the number of dimensions 


")
There are different ways to compute the latent factor vectors 

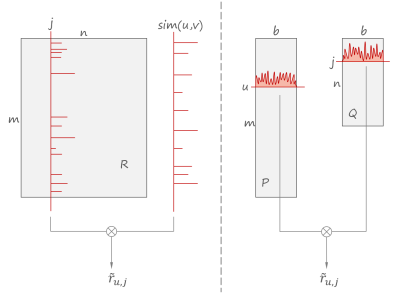
The sketch below illustrates the difference between the convolutions (2.1) and (2.3). On the left side, the sparse rating vector for a given item is convolved with the sparse similarity vector for a given user producing the estimate. On the right side, the rating is estimated by convolving two vectors of reduced dimensionality and higher energy density.
Multiple objectives. All recommendation methods discussed above are driven essentially by a single objective – to provide the best semantic match or predicted preference score. However, recommendation accuracy might not be the only concern of the recommender system design – a retailer might be interested to incorporate multiple competing objectives into the recommendations offered to the customers. For instance, grocers might be interested to boost perishables with a shorter shelf life, fashion stores might want to promote sponsored brands or seasonal collections, and a wide range of retailers can benefit from recommending products with a higher margin or from taking into account product stock levels to avoid stockouts.
A recommender system with multiple objectives was suggested in [JW10] and then developed and tested in practice at a large scale by LinkedIn [RP12]. In the case of LinkedIn, the primary objective was to recommend candidates who semantically match a job description and also, as a secondary objective, display a job-seeking behavior. The method described in [RP12] defines the recommendation task as the following optimization problem:
\right)\right\}\quad (2.4)")
_{1..K}\right)\right\}\le c")
where
is the original recommendation vector produced by the underlying recommendation systems based on semantic match and relevance, so the j-th element of
represents a relevance score (rank) for j-th product.
is a vector of secondary feature scores, so the j-th element of
corresponds to the score of the j-th product according to the secondary objective. For instance, this vector can contain product gross margins.
is a composite ranking function that combines
and
into a new item recommendation rank that balances two objectives
represents the overall utility function that measures the performance of the recommender system
denotes averaging by all recommendation realizations
denotes the first K elements with maximal score where K is the number of recommended items presented to the customer. For instance, if
contains the recommendation scores for all n products in the catalog, then
corresponds to the first K most recommended products.
is the distance function that measures the discrepancy between two recommendation vectors, and is a threshold that limits this discrepancy. According to [RP12], a reasonable practical choice for the distance measure is the sum of squared errors between two histograms of score vectors (b is the number of buckets in a histogram):
 is the original recommendation vector produced by the underlying recommendation systems based on semantic match and relevance, so the j-th element of
  is a vector of secondary feature scores, so the j-th element of
 ") represents the overall utility function that measures the performance of the recommender system
represents the overall utility function that measures the performance of the recommender system denotes averaging by all recommendation realizations
_{1...K}") denotes the first K elements with maximal score where K is the number of recommended items presented to the customer. For instance, if
denotes the first K elements with maximal score where K is the number of recommended items presented to the customer. For instance, if  corresponds to the first K most recommended products.
") is the distance function that measures the discrepancy between two recommendation vectors, and is a threshold that limits this discrepancy. According to [RP12], a reasonable practical choice for the distance measure is the sum of squared errors between two histograms of score vectors (b is the number of buckets in a histogram):
is the distance function that measures the discrepancy between two recommendation vectors, and is a threshold that limits this discrepancy. According to [RP12], a reasonable practical choice for the distance measure is the sum of squared errors between two histograms of score vectors (b is the number of buckets in a histogram):=SSE(hist(\bar{x}),hist(\bar{y}))=\sum_{i=1}^{b} (hist(\bar{x})_{i}-hist(\bar{y})_{i})^2")
The main idea of the optimization problem above is to increase the utility of the hybrid recommendations that mix relevance scores with the secondary objective, but penalize the difference between the original relevancy-based recommendations and hybrid recommendations to make sure that relevance will not be completely sacrificed in pursuit of a secondary objective. The design of the function ")
We can illustrate how the optimization model above can be adapted to the practical problems using a couple of examples. First, consider the case of a retailer who wants to incorporate the revenue objective into the recommendation scores. The overall utility function can be defined as the expected gross margin, assuming that ![m(p)\in [0,1]](http://s0.wp.com/latex.php?latex=m%28p%29%5Cin+%5B0%2C1%5D&bg=ffffff&fg=666666&s=0 "m(p)\in [0,1]")
=\frac{1}{K}\sum^n_{i=1}{m(i)\frac{\alpha}{r_i}}\cdot \delta(r_i,K),\quad \delta(r_i,K)=\begin{cases}1, & r_i\le K \\ 0, & \mbox{otherwise}\end{cases}")
where 
,m(2),\dots,m(n)\right\}\right)= \left\{r_1\cdot m(1)^\beta,\dots,r_n \cdot m(n)^\beta\right\}")
where 
The second example of re-ranking according to the secondary objective is a boosting of featured items such as on-sale products or perishables. The utility function can be specified as the average number of featured products in the short list of K recommendations:
=\frac{1}{k}\sum_{i=1}^{n}F(i)\cdot \delta(r_i,K)")
where ")
,F(2),\dots,F(n)\right\}\right)= \left\{r_1\cdot \beta^{F(1)},\dots,r_n \cdot \beta^{F(n)}\right\}")
The ranking function above can be straightforwardly extended to incorporate multiple separate features each of which contributes to the final ranking score according to its own trade-off parameter (all parameters will be optimized jointly):
}\cdot\gamma^{F_2(i)}\cdot\dots")
More details on numerical optimization algorithms for the problem (2.4) can be found in [RP12].
Problem 3 : Demand Prediction
Problem Statement
A retailer offers a category of products to its customers. The demand on a given product depends on many factors including a product’s own properties such as price or brand, prices of competing products in the category, sales events, and even the weather. The goal is to build a demand model that incorporates these factors and allows one to perform what-if analysis to forecast response on price changes, assortment extensions and reductions, compute optimal stock levels, and allocate shelf-space units.
Applications
In this section we discuss the core problem of demand prediction. It can be considered a building block that is required to model actions that affect the demand or constrained by stock levels:
- Price optimization, sales event planning, and discount targeting.
- Category management and assortment planning.
- Stock level optimization.
- Demand prediction models are generally useful in marketing campaign design because they explain the impact of regressors on demand. For instance, a demand prediction model can reveal that the price sensitivity (the measure of how much the demand changes when the price changes) on a given product strongly correlates with the package size and demographic properties of the neighborhood, suggesting the use of different prices at different stores and setting different per-unit margins for different package sizes.
We will use the demand prediction model in later sections dedicated to price optimization and assortment planning.
Solution
Demand prediction can be considered a relatively straightforward data mining problem that boils down to building a regression model and evaluating it over historical data. However, the design of the regression model is not so straightforward because the demand is influenced by many factors with complex dependencies. In this section we study a regression model suggested and evaluated in [KOK07] for Albert Heijn, a supermarket chain in the Netherlands. This model is based on earlier marketing studies such as [BG92], and fashion retailers like RueLaLa [JH14] and Zara [CA12] who also reported usage of similar models in practice. However, it is important to understand that different optimization problems require different demand prediction models and it is hardly possible to build a universal demand model that incorporates a wide variety of factors that influence demand.
We start with the following model of the demand for a given product j:
\cdot Pr(j | purchase) \cdot E\left\{Q | j; purchase\right\}")
where
- V is the number of consumers visiting the store in a given time frame e.g. during the day
is the probability that a consumer purchases any product from the category during her visit to the store
is the probability that a consumer chooses the product j among other alternatives when the purchase takes place
is the mathematical expectation of the quantity (number of units) purchased by the consumer given the product j had been chosen and purchased
") is the probability that a consumer purchases any product from the category during her visit to the store
is the probability that a consumer purchases any product from the category during her visit to the store") is the probability that a consumer chooses the product j among other alternatives when the purchase takes place
is the probability that a consumer chooses the product j among other alternatives when the purchase takes place is the mathematical expectation of the quantity (number of units) purchased by the consumer given the product j had been chosen and purchased
All factors in the equation (3.1) can be estimated from the transactional data from the stores. The demand generally depends on date (day of the week, holidays etc.) and store (size, neighborhood demographics etc.), so we introduce subscripts 

=\alpha_1+\alpha_2T_t+\alpha_3W_t+\sum_{i=1}^7\alpha_{3+1}B_{ti}+\sum_{i=1}^H\alpha_{10+i}E_{ti}")
where 


The purchase incidence is a binary variable (purchase/no purchase), so we can use a standard modeling approach – express the purchase probability as a sigmoid function and estimate its exponential parameter from the data:
=\frac{1}{1+e^{-x}}\quad\Longleftrightarrow\quad x\stackrel{def}{=}\ln\left(\frac{Pr(purchase|visit)}{1-Pr(purchase|visit)}\right)")
The regression model for x will be

where 


Estimation of ")
=\frac{\exp(y_j)}{\sum_i \exp(y_i)}")
where i iterates over all products in a category and 
+\gamma_{N+2}(A_{jht} - \bar{A}_{ht}),\quad j\in1\dots N")
where the coefficients 


Finally, the average number of units sold can be modeled as follows:

By substituting the models above to the root expression (3.1) one obtains a fully specified demand prediction model. This model can be adjusted to a retailer’s business use cases by adding more explanatory variables such as marketing events.
Problem 4 : Price Discrimination
Problem Statement
A retailer offers a category of products to customers. The goal is to assign an individual price for each customer in order to maximize the overall revenue. Alternatively, the problem can be restated as targeting discounts that change prices compared to the common baseline.
Applications
Price discrimination is widely used in retail and there are many explicit and implicit forms of it:
- Coupons, store-level price zones, and discounts are all examples of price discrimination.
- Price discrimination relates to up-sell via quantity discounts.
- Dynamic pricing can use price discrimination principles and models to incrementally adjust prices.
Although we have stated the problem in a way that suggests fine-grained individual prices, it is an extreme case and the more typical approach is to set prices for larger customer segments.
Solution
Price discrimination is one of the most fundamental problems in economic and marketing [SM11], so it makes sense to start with some background on classic economics. Broadly speaking, a retailer, as well as any other commercial enterprise, can be modeled using the following basic equation:
-C\quad(4.1)")
where 


")
In other words, the elasticity of demand is a ratio between the percentage change in quantity demanded and the percentage change in price. The equations (4.1) and (4.2) can be visualized as follows:

The demand curve is a line with a slope defined by the elasticity of demand and a retailer’s profit is the difference between the revenue and variable costs, numerically equal to \cdot Q_0")

Despite the limitations of economic price optimization, equations (4.1-4.2) shed some light on the nature of price discrimination. Any single price

This consideration leads to the challenging question of how a retailer can sell the same product to different customers at different prices. Broadly speaking, it requires setting fences between customers with different willingness to pay in such a way that customers with higher willingness will not be able to a pay a lower price intended for the lower segments. Retailers have a number of fencing mechanisms at their disposal including the following:
- Store zone. Stores in the retail chain are typically located in different neighborhoods with different demographic and competitive factors such as the average household income, average family size, distance to the nearest competitive store etc. It naturally separates customers by levels of price sensitivity and ability or willingness to look for an alternative supplier. It enables a retailer to set store-level prices that differ in different zones.
- Package size. Fast-moving consumer goods (FMCG) such as soft drinks or toiletries have high turnover rates and consumers naturally have a choice between buying small amounts of product frequently and stockpiling larger amounts. This tradeoff is also impacted by demographic factors such as household size. It creates fences by willingness to buy large or small packages and enables setting different per-unit margins for different package sizes. Buy-one-get-one (BOGO) offers also relate to this category.
- Sale events. Customers can be differentiated by their willingness to wait for a lower price versus willingness to buy immediately at the regular price. This type of segmentation is widely used in the apparel domain where seasonal sales are one of the main marketing mechanisms.
- Coupons. Many customers might not be willing to buy a given product at the regular price but might consider buying it at a discounted price. Hence a retailer can benefit from a discount because it generates additional customers, although their margins are lower compared to the purchasing habits of regular customers. On the other hand, it might be harmful to offer a discount to an excessively wide audience because it will be used even by customers who would be willing to pay the regular price (in the absence of the discount). The response modeling techniques discussed in one of the previous sections help to solve this problem. However, there is a traditional solution in use since the 19th century – couponing. A coupon represents a price discount that requires some effort to earn or redeem (e.g. a customer has to find it in a newspaper, cut it out, and present at a store), fencing customers by willingness to spend time and effort getting a discount.
- Sale channels. Sale channels naturally represent fences because customers select channels by criteria that strongly correlate with their willingness to pay. For instance, price sensitivity of liquor store shoppers is consistently lower compared to customers who buy the same wine in grocery stores [CU13].
Although all these techniques have long been in use, the problem of building an integrated discount optimization model is very challenging and, to the best of our knowledge, all existing models are limited in one way or another. In the rest of this section we consider two price discrimination models that were designed and evaluated using data from US supermarkets, in particular Safeway’s subsidiary in Chicago.
Discrimination by quantity and location. The model developed in [KJ05] aims to jointly optimize quantity discounts based on package sizes and store-level price zones. This model is quite similar to the model we studied in the section dedicated to demand prediction, however it elaborates more on package size and discount parameters.
Let us consider the case of a retailer that operates multiple stores and sells a few substitutable brands of a product that comes in several sizes e.g. 2, 4 and 6 packs of Coca-Cola and Pepsi. The goal is to optimize prices for each size assuming that price per unit can vary depending on the package size and that price settings can vary across the stores as well. We start with the standard multinomial logit (MNL) model for demand prediction that we have discussed in a previous section:
=\frac{\exp(x_{juts})}{1+\sum_{k=1}^{J} x_{kuts}}\quad (4.3)")
which denotes the probability of purchase of product variant 


where 


")
where 


")
where 
The equation (4.3) allows one to predict sales volumes, so the price optimization problem then can be stated based on the equation (4.1), independently for each time period :
\cdot Q_{jt}\quad (4.4)")

where 


Personalized discounts and coupons. Although the previous model allows for store-level prices which implies customer-level price discrimination, it is not designed for optimized discounts for individual customers. The second model we consider [JT13] was designed specifically to optimize personalized discounts or coupons. The main advantage of this model is that it optimizes not only the depth of the discount, but also tries to find the optimal time to offer a discount to a given user and its optimal duration. The idea of temporal properties optimization comes from the assumption that a customer’s probability to purchase is not uniform and varies over time, so there is an optimal discount time window for each user. The major shortcoming of this instead of a category, hence it can be used to optimize performance of a particular brand e.g. manufacturer promotions, but cannot be used for category management.
In order to model the temporal properties of a discount, we will decompose the probability of the purchase of product j by customer u at time t assuming discount depth d into a product of the product purchase probability and probability to make a purchase at time t:
\cdot p(time=t|u;d)")
The probability density function of the purchase of a given product can be estimated using MNL model we used in the equation (4.3). The probability density function of a purchase at time t is modeled in [JT13] in the form of an Erlang distribution:
=y_u^2\cdot t \cdot \exp(-y_u t)")
where the parameter variable 
The probability of a purchase defined above enables us to model the sales volume for a given customer 
=\int_t^{t+T} p_{jtud} dt")
This leads us to the following optimization problem for gross margin:
+Q_u(d,t,t+T)+Q_u(0,t+T,\infty)\right) - d \cdot Q_u(d,t,T)")
where m is the margin at the regular price. The first term in the equation above corresponds to the revenue that in turn consists of three components – revenue received before the promotion, during the promotion, and after the promotion – and the second term corresponds to promotional costs. The following chart shows this optimization problem:
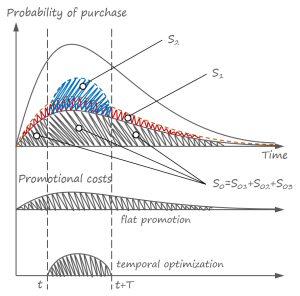
The first plot on the top shows the probability density of purchase by customer u where the expected sales volume for a given product at the regular price corresponds to the 


Problem 5 : Sales Event Planning
Problem Statement
A retailer prepares a sales event – a limited-time discount on a particular product or group of products. The event planning requires the estimation the following dependent values:
- What product stock levels are needed to avoid stockouts before the end of the event?
- What price maximizes revenue? The price can be considered a constant value or a function of time on the interval from the beginning of the event to its end.
We will consider a case where the stock level is predefined and a retailer is trying to calculate optimal prices. This problem statement is typical for fashion retailers who deal with seasonal clearance sales and collection renewals [JH14, CA12]. The problem can be stated in many different ways both to study demand forecasting and price optimization as separate problems and to optimize stock levels and prices simultaneously in order to achieve maximal revenue.
Applications
Sales event planning has several applications in retail:
- Clearance and seasonal sales are one of the main vehicles in fashion retailing.
- Some business models like flash retailing (also known as pop-up retailing) use sales events as the only way to sale.
- Retailers of fast-moving consumer goods and perishables can use event planning techniques to align sales paced with product shelf life.
Solution
Dynamic demand prediction and price optimization are fundamental problems studied in the economic discipline called revenue management. The theory of revenue management is well-developed and systematically described in books like [TA05]. The most advanced and efficient examples of revenue management automation are found in the service industries that deal with reservations – flight tickets, stadium seats, hotel rooms, rental cars etc. To understand how such techniques can be leveraged in the retail space, we will consider a methodology recently developed by RueLaLa, a fashion retailer [JH14].
Let us assume that a retailer plans to provide a discount on 
It is assumed that all products or product groups in the sales event have something in common, e.g. belong to the same category like “Women’s Shoes” or “Christmas Eve Foods”, hence demand on one product is potentially dependent on the price of other products that can be used as substitutes. This assumption can be incorporated into the optimization model by introducing the variable 


The binary variable 

The optimization problem above requires the estimation of the demand
Problem 6 : Category Management
Problem Statement
A retailer sells products by categories. A category represents a relatively cohesive set of products that have a lot in common (examples of categories are “desserts”, “women’s jeans” etc.), so it is generally possible that customers might be willing to substitute one product with another if the product of their choice is not available for some reason. The main reasons for product unavailability are permanent assortment reductions (e.g. because of limited shelf space) and temporary stockouts. The goal is to calculate a subset of products that meets physical constraints such as available shelf space and maximizes the gross margin by taking advantage of the substitution effect in the optimal way.
Applications
Category management is a relatively specialized task, but it deals with substitution effects that come up in other problems like promotion optimization when the goal is to optimize the overall performance of a product category as opposed to performance of a single product. Retailers are typically much more interested in the overall category performance rather than optimization of individual products, so the methods described in this section can be useful in many other applications to achieve truly optimal solutions. The model studied in this section can be directly applied to the following flavors of category management:
- Optimization of product stock levels at a warehouse. One particularly important application is inventory management for perishable products taking into account shelf life and potential losses caused by expired products.
- Optimization of shelf layouts to adjust relative product shares on a shelf.
- Assortment planning (what products can be introduced to or removed from the assortment)
Solution
From an econometric perspective, the problem of category management arises from the law of diminishing returns or, more specifically, the fact that revenues and costs depend on the category size in different ways. The general tendency is that consumer buying capacity comes to saturation at some point meanwhile costs continue to grow because of increasing selling area and other operational costs:

This tendency leads to the category optimization problem. It is a very challenging problem because it requires the modeling of an entire category accounting for interdependencies between the products in it. However, despite these challenges, a practically feasible assortment optimization model has been developed in [KOK07] and applied at Albert Heijn, a supermarket chain in the Netherlands. To study their approach, let us first introduce the following notation:
– maximal set of products in a category that a retailer offers to its customers i.e. the full assortment.
– stock level for the product j. A retailer optimizes its assortment by choosing
to be zero (product is not present in the assortment) or non-zero.
– total inventory capacity measured in the same units as stock levels. It is assumed that the sum of stock levels of all products cannot exceed
. The total capacity can be constrained by warehouse or available shelf space in a store.
– assortment in the store h, a subset of the full assortment.
denotes the original demand rate for the product j (the number of customers who would select the product j if presented with full assortment N)
– observed demand rate for the products (the actual number of customers per day who selected the product j because of their original intention or substitution). The observed demand for a given product depends on the demand and availability of other products because of the substitution effect i.e. it can be thought as the following function:
 – maximal set of products in a category that a retailer offers to its customers i.e. the full assortment.
 – stock level for the product j. A retailer optimizes its assortment by choosing
  to be zero (product is not present in the assortment) or non-zero.
 – total inventory capacity measured in the same units as stock levels. It is assumed that the sum of stock levels of all products cannot exceed
  – assortment in the store h, a subset of the full assortment.
 – observed demand rate for the products (the actual number of customers per day who selected the product j because of their original intention or substitution). The observed demand for a given product depends on the demand and availability of other products because of the substitution effect i.e. it can be thought as the following function:
 ")
Using the above notation, the assortment optimization problem can be specified as follows:
\right) \quad (6.1)")

where 
=m_j\cdot D_j\quad (6.2)")
=m_j\cdot min(D_j,f_j)\quad (6.3)")
=m_j\cdot min(D_j,f_j) - L_i \cdot (f_i - min(D_j,f_j))\quad (6.4)")
The equation (6.2) represents the simplest way to model gross profit by multiplying the observed demand by margin m. It implicitly assumes perfect replenishment and the absence of stockouts. This might be the case for fast moving consumer goods like groceries, but other retail domains such as apparel probably should take stockouts into account using equations like (6.3). Retailers of perishable goods should also take into account the losses due to disposed inventory that are modeled in the equation (6.4) by introducing a per-unit disposal loss 

To solve the optimization problem (6.1), one needs to define the observed demand function. In the case of the stockouts-free assumption we made above, the demand function can be modeled as follows:
=d_j + \sum_{k:f_k=0}\alpha_{k \rightarrow j}\cdot d_k\quad (6.5)")
where 
The equation (6.5) requires the estimation of the substitution probabilities 
– the demand for product j per customer at store h. Assuming that
is the number of customers who visit store h during the day,
– the demand for product j per customer at store h with a full assortment (let us assume that stores with full assortments exist).
corresponds to the original demand since no substitution happens at stores with the full assortment.
 – the demand for product j per customer at store h. Assuming that
  is the number of customers who visit store h during the day,
 – the demand for product j per customer at store h with a full assortment (let us assume that stores with full assortments exist).
 The substitution rates 

")
")
In order to estimate 
")
On the other hand, the same value can be estimated according to the expression (6.5) as follows:
=\sum_{j\in N_h} \left(Q_{jh}^0 + \sum_{k\in N\setminus N_h}\alpha_{k\rightarrow j}Q_{kh}^0\right)=\sum_{j\in N_h}Q_{jh}^0 + \sum_{j\in N_h} \sum_{k \in N\setminus N_h} \frac{\delta}{|N|} Q_{kh}^0\quad (6.8)")
Now
-\mathbb{Q}_h)^2\quad (6.9)")
The next step in solving the optimization problem (6.1) is to compute the original demand rates that are used in the equation (6.5). We first note that the total demand for all products in N at store h can be computed as follows:
}\quad (6.10)")
where 

In a store with a restricted assortment, the total demand 
/\left(\sum_{j\in N} Q_{jh}^0\right)\quad(6.11)")
Consequently, 
")
\cdot\frac{Q_{jh}^0}{\sum_{j\in N\setminus N_h} Q_{jh}^0},\quad & \mbox{if } j \notin N_h\end{cases}\quad (6.12)")
All coefficients in equations (6.12) and (6.9) can be estimated from the data, so we can roll up all formulas to the original optimization problem (6.1) that can be solved using numerical methods proposed in [KOK07].
Equation (6.1) will produce a set of presumably optimal stock levels 
Financial Impact
Our overview of optimization methods and the corresponding data problems would be incomplete without data about the financial performance of the discussed methods. Although this data is available, it should be considered with caution because of the specific dependency on a retailer’s business model, and the fact that we cannot isolate the impact of the optimization from other environmental factors such as market growth or competitors’ moves. Besides that, the numbers can vary greatly depending on many factors, so our goal here is just to provide a few benchmarks that give some sense of the magnitude of potential improvements. The following list gathers several facts that give some idea about financial impact of the described methods:
- Response modeling is extensively used throughout marketing, from retail to presidential campaigns [EP13]. It is often reported that response modeling can increase the profitability of a campaign by 20-30% compared to random targeting, and uplift modeling can play an important role by adding a substantial performance boost of about 15% or by making profits in challenging cases where alternative approaches do not work [PS08].
- The sales event optimization suggested in [JH14] was thoroughly evaluated in practice at RueLaLa with the general conclusion that comprehensive optimization models can outperform previously used heuristics by about 10% in terms of revenue increase. The event optimization model described in [CA12] and tested by Zara claims to provide about a 5.8% increase in revenues.
- Category management framework has been evaluated at Albert Heijn to optimize assortment in 25 subcategories at 37 stores. It was found that among these 25×37=1295 cases, 701 were suboptimal and optimization could increase the gross margin on about 6.2% compared to traditional methods used by the company [KOK07].
Finally, it is worth noting that most of the described optimization methods do not significantly impact retailer’s costs, so the increase in revenues is likely to contribute directly to net profits.
Conclusions
In the previous sections we overviewed a number of econometric problems relevant to retail, described their applications and use cases, and outlined data analysis tasks and optimization models that can be used. In this final section we will connect the dots between the discussed models and provide general conclusions to capture the whole picture.
Connecting the Dots
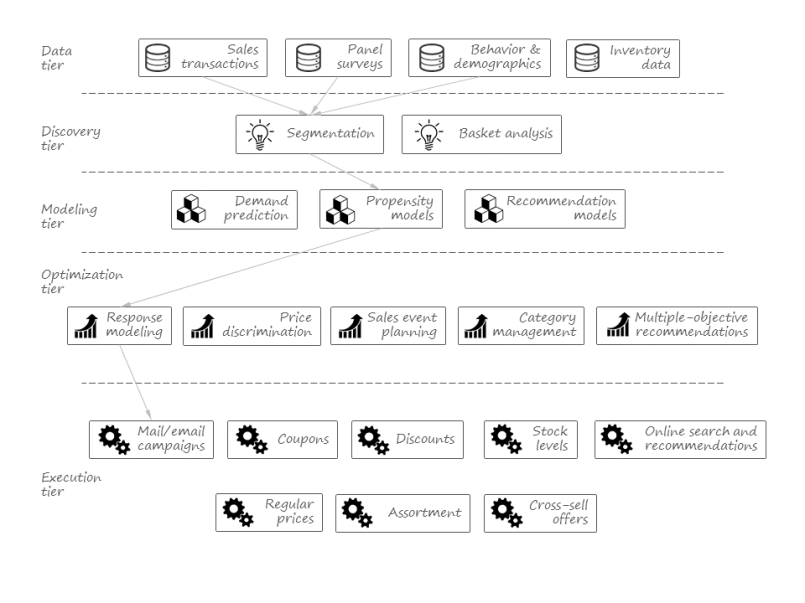
The major goal of this article is to sketch a decision automation framework that completely relies on data mining and numerical optimization under the hood. Hence, it is reasonable to visualize this framework as a pipeline that consumes data and produces executable actions and decisions. Reviewing the solutions studied in the previous sections, we can also conclude that this pipeline has several internal stages or tiers.
First, we can put data exploration and knowledge discovery processes into a separate tier that uses mainly unsupervised learning algorithms and significantly relies on a human factor to evaluate data mining results such as customer clusters or frequently purchased item sets. Although these processes are highly important in practice, their ability to integrate with automated optimization is limited because discovered patterns typically require manual post processing and are more useful in strategic decisions rather incremental optimizations. Outputs of this tier can be used to configure downstream processes. For instance, a newly discovered customer cluster can be used to define a new propensity model or introduce and optimize a special discount.
The next two tiers relate to modeling and optimization, respectively. Broadly speaking, the fundamental goal of the modeling tier is to provide a comprehensive model of a consumer that quantitatively describes his or her price sensitivity, propensity to respond to offers and discounts, willingness to substitute one product with another, and to accept a recommendation, etc. It is extremely hard to build such a model in practice, so multiple specialized models for different applications are used instead. However, it is critical to note that this imaginary consumer model underlays all types of optimization, hence acquiring comprehensive data about all aspects of customer behavior is crucial. The main challenge of the optimization tier is a joint optimization of multiple objectives. Joint optimization represents a serious computational challenge and, most importantly, is constrained by the capabilities of the underlying predictive model, so almost all optimization techniques deal with not more than one or two objectives.
We put together these tiers in the figure below. There are many possible dependencies and interactions between the components, so we show just one sample flow related to response modeling to prevent cluttering the diagram.
Importance of Pricing
Among this diversity of problems and goals, we should emphasize the importance of pricing decisions and all the optimizations directly or indirectly related to pricing. Let us consider a classic example that illustrates the importance of pricing decisions. Recall the basic equation for enterprise profit:
-C")
where Q is quantity sold, P is price, V denotes variable costs, and C denotes fixed costs. Consider an imaginary apparel retailer that sells 100,000 garments monthly at $40 per item, assuming a wholesale price of $25 per item and fixed costs of $500,000 per month. Let us calculate how a one percent change in sales volume, price, variable and fixed costs will impact profit:
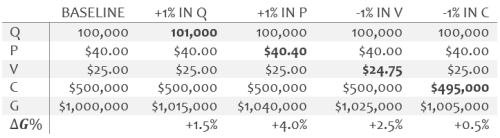
In this example, one can see that pricing impacts the profits much more seriously than any other variable. Although it is an oversimplified and arbitrary example, this pattern prevails in a huge variety of enterprises across many industries. This leads us to the conclusion that retailers should pay special attention to the optimization methods related to pricing (discounts, personalized prices, dynamic pricing etc.) and the supporting data mining processes.
We also note that omni-channel retail can deliver new opportunities for automated price optimization. Since price discrimination is one of the most powerful pricing techniques, the ideal environment for price optimization is an environment where each customer is provided with a personalized price, explicitly or implicitly by means of discounts, and all these prices can be adjusted dynamically. Digital channels provide exactly these conditions where each customer has his or her own isolated and dynamic view of a retailer.
Importance of Implicit Dimensions
As we already mentioned, most optimization problems in retail are internally dependent on customer behavior models. The ability to build such models at the level of individual customers is one of the most important benefits of data mining and a key enabler of one-to-one marketing. The most sophisticated examples of customer modeling can be found in recommender systems that often use the concept of implicit dimensions to capture psychographic features of customers and products. This concept is so fundamental that it probably goes far beyond recommender systems, although, to the best of our knowledge, it is not so widely used in other applications as one might expect. It leads us to the conclusion that integrated optimization systems can benefit by adopting state-of-the-art techniques from the well-developed recommendations domain in less common applications.
Outlook
The problem of completely automated decision making in the retail environment is extremely ambitious. It can even be argued that it is almost impossible to measure the performance of optimization methods in practice because the observed improvements can coincide with market trends, competitors’ actions, changes in customer tastes and myriad other factors. This problem, referenced as the endogeneity problem in economic texts, represents a huge challenge for developers and adopters of data-driven optimization techniques and compromises even seemingly successful attempts. However, during the last decade major retailers have been looking for integrated solutions that combine data mining with numerical optimization. Such advanced systems are naturally the next step in the evolution of enterprise data management that follows such a wide appreciation of data warehousing and adoption of data science.
References
- [AG13] Retail Supply Chain Management, Narendra Agrawal and Stephen A. Smith, 2009
- [AS14] A Practical Guide to Data Mining for Business and Industry, Ahlemeyer-Stubbe A. Coleman S.
- [BE09] Differential Response or Uplift Modeling, M. Berry, 2009
- [BE11] Data Mining Techniques: For Marketing, Sales, and Customer Relationship Management, G. Linoff and M. J. A. Berry, 2011
- [BG92] Brand choice, purchase incidence, and segmentation: An integrated modeling approach, R. Bucklin and S.Gupta, 1992
- [BR98] Empirical Analysis of Predictive Algorithms for Collaborative Filtering, J. S. Breese, D. Heckerman, and C. Kadie, 1998
- [CA12] Clearance Pricing Optimization for a Fast-Fashion Retailer, F. Caro, J. Gallien, 2012
- [CN10] Market-Share Analysis, L.G. Cooper, M. Nakanishi, 2010
- [CU13] Retail Channel Price Discrimination, S. Cuellar, M. Brunamonti, 2013
- [DG12] How Companies Learn Your Secrets, C. Duhigg, 2012
- [DR90] Indexing by Latent Semantic Analysis, S. Deerwester, S. Dumais, G. Furnas, T. Landauer, and R. Harshman, 1990
- [EP13] How uplift modeling helped Obama’s campaign – and can aid marketers, E. Preslar, 2013
- [FAD74] Conditional logit analysis of qualitative choice behavior, D. McFadden, 1974
- [FX06] Predicting Retail Customers’ Share-of-Wallet Using Shopper Loyalty Card Data, E. Fox and J. Thomas, 2006
- [GH02] Using Text Mining to Infer Semantic Attributes for Retail Data Mining, Rayid Ghani and Andrew E. Fano, 2002
- [JH14] Analytics for an Online Retailer: Demand Forecasting and Price Optimization. K. Johnson, B.H.A. Lee, D. Simchi-Levi, 2014
- [JK98] A Microeconomic View of Data Mining, J. Kleinberg, C. Papadimitriou, P. Raghavan, 1998
- [JL11] Dynamic Price Optimisation for The Retail Market, J. Lippert, 2011
- [JT13] To Whom, When, and How Much to Discount? A Constrained Optimization of Customized Temporal Discounts, J. Johnson, Tellis, E. Ip, 2013
- [JW10] Optimizing multiple objectives in collaborative filtering, T. Jambor and J. Wang, 2010
- [JZ10] Recommender Systems: An Introduction, D. Jannach, M. Zanker, A. Felfernig, G. Friedrich, 2010
- [KJ05] An Empirical Analysis of Price Discrimination Mechanisms and Retailer Profitability, R. Khan and D. Jain, 2005
- [KOK07] Demand Estimation and Assortment Optimization Under Substitution: Methodology and Application, A. J. Kok, M. Fisher, 2007
- [LE13] The Definitive Guide to Predictive Analytics Models for Marketing, D. Levin, 2013
- [MA04] Collaborative Filtering: A Machine Learning Perspective, B. Marlin, 2004
- [MA08] Introduction to Information Retrieval, C. Manning, P. Raghavan, H. Schütze, 2008
- [PR13] Data Science for Business: What you need to know about data mining and data-analytic thinking, F. Provost, T. Fawcett, 2013
- [PS08] Optimal Targeting through Uplift Modeling, Portrait Software, 2008 [http://www.crmxchange.com/uploadedFiles/White_Papers/PDF/Optimal_Targeting_with_Uplift_Modeling_white_paper.pdf]
- [PY99] Data Preparation for Data Mining, D. Pyle, 1999
- [PZ07] Content-based Recommendation Systems, M. Pazzani, D. Billsus, 2007
- [RE03] A SAS Market Basket Analysis Macro: The “Poor Man’s Recommendation Engine”, M. Redlon, E. Prairie, 2003
- [RE94] Grouplens: an open architecture for collaborative filtering of netnews, P. Resnick, N. Iacovou, M. Suchak, P. Bergstrom, and J. Riedl, 1994
- [RP12] Multiple Objective Optimization in Recommender Systems, M. Rodriguez, C. Posse, E. Zhang, 2012
- [RR10] Recommender Systems Handbook, F. Ricci, L. Rokach, B. Shapira, P. B. Kantor, 2010
- [RU00] Data Mining Cookbook: Modeling Data for Marketing, Risk and Customer Relationship Management, O. Rud, 2000
- [SA00] Application of Dimensionality Reduction in Recommender System – A Case Study, B. M. Sarwar, G. Karypis, J. A. Konstan, J. T. Riedl
- [SA01] Item-Based Collaborative Filtering Recommendation Algorithms, B. Sarwar, G. Karypis, J. Konstan, and John Riedl, 2001
- [SB09] The Numerati, Stephen Baker, 2009
- [SG09] Propensity Score Analysis: Statistical Methods and Applications, S. Guo, M.Fraser, 2009
- [SM11] Pricing Strategy: Setting Price Levels, Managing Price Discounts and Establishing Price Structures, T. Smith, 2011
- [SU09] A Survey of Collaborative Filtering Techniques, X. Su, T. Khoshgoftaar, 2009
- [TA05] The Theory and Practice of Revenue Management, K. Talluri, G. J. van Ryzin, 2005
- [VL02] The True Lift Model – A Novel Data Mining Approach to Response Modeling in Database Marketing, V. Lo, 2002
- [WE07] Evolving Classifiers – Evolutionary Algorithms in Data Mining, T. Weise, S. Achler, M. Gob, C. Voigtmann, and M. Zapf, 2007
- [YK08] Factorization Meets the Neighborhood: a Multifaceted Collaborative Filtering Model, Y. Koren, 2008
- [YK09] Matric Factorization Techniques for Recommender Systems, Y. Koren, R. Bell, C. Volinsky, 2009

